

Understanding financial metrics is essential for understanding how your business is performing. We share the 14 most important financial metrics to track to keep on top of your business’s financial health.
Startups.co.uk is reader supported – we may earn a commission from our recommendations, at no extra cost to you and without impacting our editorial impartiality.
Managing your finances is a major part of running a business. But with so many financial metrics to calculate, it can be hard to know which ones to watch.
That’s why using accounting software like Xero with your accountant/bookkeeper can make it easier to monitor your business’s financial performance, as it helps you track your performance with real-time reports and keeps your finances organised – helping you cut hours off your bookkeeping so you can focus on running your business, not your books.
In this article, we’ll share the key financial metrics for small businesses, including what they mean, how to calculate them, and why they’re important for your business – giving you a better understanding of your business’s financial health and how to make more informed decisions.
- The most important financial metrics should focus on profitability, cash flow, liquidity, efficiency, and unit economics.
- Gross profit margin, net profit margin, operating cash flow (OCF), current ratio and quick ratio are essential metrics for understanding financial performance.
- You should look at the break-even point, customer acquisition cost (CAC), customer lifetime value (LTV), and debtor days for help in decision-making.
- To prepare for Making Tax Digital (MTD), look at gross qualifying income, unreconciled transaction count, real-time estimated tax liability, and debtor days and creditor days.
- Accounting tools like Xero help you track performance, letting you monitor business performance in real time.

Get 90% off Xero for the first six months
Supercharge your small business accounting
In this article, we’ll cover:
What are the most important financial metrics for small businesses?
The most important financial metrics for small businesses are ones that focus on profitability, liquidity and cash flow, operational efficiency, and unit economics.
Tracking these metrics will help you determine whether you can cover everyday expenses, how smoothly your operations are running, and your return on investment (ROI).
Key business financial metrics: an overview
| Metric name | Metric category | What it measures | Tracking frequency |
|---|---|---|---|
| Gross profit margin | Profitability | Profit remaining after the direct costs of making a product or delivering a service | Monthly (or weekly for retail/ecommerce |
| Net profit margin | Profitability | How much profit is left after all expenses, taxes, and overheads | Monthly |
| Operating cash flow (OCF) | Cash flow | Total cash generated by day-to-day business operations | Monthly |
| Cash runway/burn rate | Cash flow | How many months the business can operate before running out of cash | Monthly (or weekly for startups/high-growth businesses) |
| Current ratio | Liquidity | Ability to cover short-term debts within a year using short-term assets | Monthly or quarterly |
| Quick ratio (acid-test)Quick ratio (acid-test) | Liquidity | Ability to pay short-term obligations without needing to sell inventory | Monthly or quarterly |
| Debtor days | Efficiency | Average time it takes B2B clients to pay their invoices after billing | Monthly |
| Break-even point | Efficiency | The total turnover required to cover all fixed overheads and variable costs | Quarterly (or whenever costs or pricing change) |
| Customer acquisition cost (CAC) | Unit economics | The fully loaded cost to acquire a single new paying customer | Monthly |
| Customer lifetime value (LTV) | Unit economics | The total gross profit or revenue a customer generates over their entire relationship with your business | Quarterly (or monthly for subscription/SaaS businesses) |
What are the key financial performance metrics?
The most important financial performance metrics to track are:
- Gross profit margin
- Net profit margin
- Operating cash flow (OCF)
- Current ratio
- Quick ratio.
Using strong-performing software to automate accounting processes allows you to centralise financial data and generate real-time reports easily.
For example, Xero‘s financial reports bring all your accounting data into an easy-to-read set of reports, giving you a single source of truth in real time. Its intuitive interface lets you monitor your business’s financial health, identify trends, and make faster and smarter decisions with real-time financial reports.
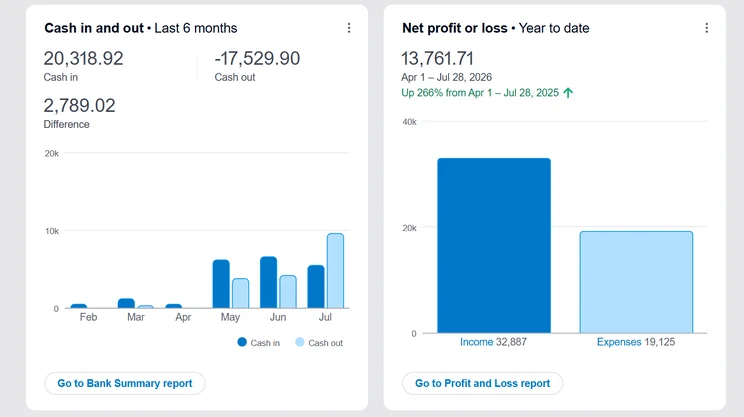
Gross profit margin
Gross profit margin shows how much money your business keeps from sales after paying the direct costs of making your products or delivering your services.
To calculate it, take your total sales income, subtract the direct costs of making or delivering your product/service, divide the result by your total sales income, then multiply by 100 to get the percentage.
Net profit margin
Net profit margin shows how much money your business keeps after paying all expenses, including rent, wages, software, taxes, and other costs.
To calculate your net profit margin, take your total sales income, subtract all business overheads, divide the remaining profit by your total sales income, then multiply by 100 to get the percentage.
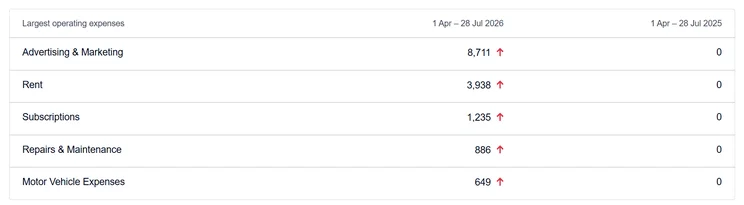
Operating cash flow (OCF)
Operating cash flow (OCF) shows how much actual cash a business generates from its normal day-to-day operations.
For this, start with your net profit, add back costs that do not involve paying cash (like depreciation and amortisation), then adjust for changes in working capital (such as money owed by customers, stock levels, and money owed to suppliers).
Current ratio
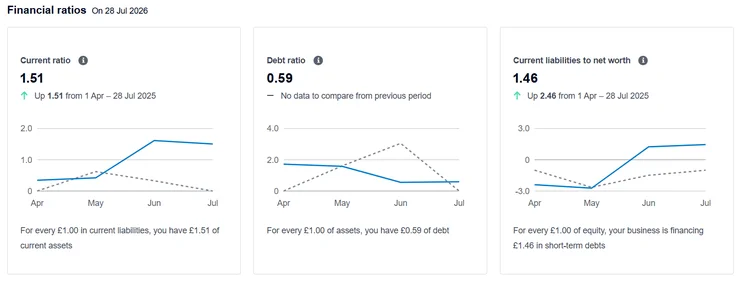
Current ratio shows whether a business has enough short-term assets to pay its short-term debts.
Simply add up everything your business owns that can be turned into cash within the next 12 months (such as cash in the bank, unpaid customer invoices and stock), then divide that amount by all the bills and debts due within the next 12 months (like loans, overdrafts and taxes). Here’s a breakdown of what each result means:
- Ratio is less than 1.0: the business owes more in the short term than it has available in liquid assets, meaning it risks running out of cash to cover the bills.
- Ratio is 1.5-2.0: the business has a comfortable buffer to handle unexpected expenses without holding too many idle resources.
- Ratio is higher than 2.0: safe, but holding too much sitting cash or unsold inventory means capital isn’t being reinvested effectively to grow the business.
Quick ratio
Quick ratio (also called the acid-test ratio) shows whether a business can pay its short-term debts using its most easily available assets without relying on selling stock.
Add up the cash you have and money customers owe you (or subtract stock from your current assets), then divide it by the short-term bills and debts you need to pay within the next 12 months.
The result will tell you how many pounds of liquid cash you have for every £1 you owe this year. For example:
- Result = 0.70: you only have 70p of liquid assets for every £1 owed.
- Result = 1.0: you have exactly £1 of liquid cash and near-cash for every £1 you owe this year.
- Result = 1.2: you have exactly £1.20 of liquid cover for every £1 owed.
Note: Unsold stock isn’t included in this calculation because you can’t guarantee how fast it’ll sell, and discounting it quickly usually eats into your profit margins.
What are the most important financial metrics for decision making?
The key financial metrics for decision making are:
- Break-even point
- Customer acquisition cost (CAC)
- Customer lifetime value (LTV)
- Cash runway/burn rate
- Debtor days
These metrics give you useful insights into your business’s profitability, growth, liquidity and operational efficiency – helping you make more informed strategic decisions in the future.
Once again, this is where good accounting software comes in handy, especially when working with an accountant or bookkeeper. Tools like Xero bring your key metrics into one centralised dashboard, giving both you and your advisor a real-time view of your financial performance. With unlimited general users at no extra cost, tracking the metrics that matter becomes a seamless team effort.
Break-even point
Break-even point (BEP) shows the point where a business earns enough revenue to cover all its costs – meaning it makes no profit and no loss.
To calculate BEP, work out your fixed costs (such as rent, salaries and insurance), then divide this by the profit made from each sale after paying the direct costs of making the product or providing the service. Here’s a quick example:
- Fixed costs = £10,000
- Selling price per item = £50
- Variable cost per item – £30
- Amount left from each sale = £20
- Calculation: £10,000 ÷ £20 = 500
In this case, the business needs to sell 500 items to break even. After that point, sales start generating a profit.
Customer acquisition cost (CAC)
Customer acquisition cost (CAC) measures how much you’re spending on sales and marketing to gain each new customer.
You can calculate CAC by adding up all the money spent on marketing and sales (such as advertising, sales staff, commissions, agencies and software), then dividing it by the number of new paying customers gained during the same period. For example:
- Sales and marketing costs = £5,000
- New customers gained = 100
- Calculation: £5,000 ÷ 100 = £50
The CAC is £50, meaning it costs the business £50 to acquire each new customer.
Customer lifetime value (LTV)
Customer lifetime value (LTV) measures how much revenue a business expects to earn from one customer over the time they stay within the business.
LTV is calculated by multiplying how much a customer usually spends each time they buy, how often they buy, and how long they remain a customer. For example:
- Average order value = £50
- Customer buys four times a year
- Average customer lifespan = five years
- Calculation: £50 x 4 x 5 = £1,000
The customer lifetime value is £1,000, meaning that the customer is expected to generate £1,000 in revenue over their relationship with the business.
Note: Calculating CAC and LTV requires accurate data from both your marketing and accounting systems. An accountant or financial advisor can help check these calculations and ensure your decisions are based on reliable information.
LTV is often used with CAC to determine the long-term ROI of your sales and marketing spend and test whether your business model is sustainable. When using them together in a ratio, here are the kinds of results you get:
- Under 1:1: you lose money on every customer you acquire
- 1:1: every penny made from a customer goes straight back into acquiring them, leaving zero profits to cover expenses
- 3:1: for every £1 spent on sales and marketing, you generate £3 in lifetime value
- 5+:1: you may not be spending enough on marketing, thus missing out on growth opportunities
Cash runway and burn rate
Burn rate refers to how much cash your business loses over a specific time period (usually a month). You can look at burn rate in two ways:
- Gross burn rate: the total cash spent on operational costs each month (like rent and salaries), not including any incoming revenue.
- Net burn rate: the total cash lost after taking incoming revenue into account.
Meanwhile, cash runway uses your net burn rate to calculate how much time (in months) your business can keep operating before running out of money.
To calculate cash runway, simply divide your total bank balance by your net monthly burn rate to find out how many months of cash reserves you have remaining.
Debtor days
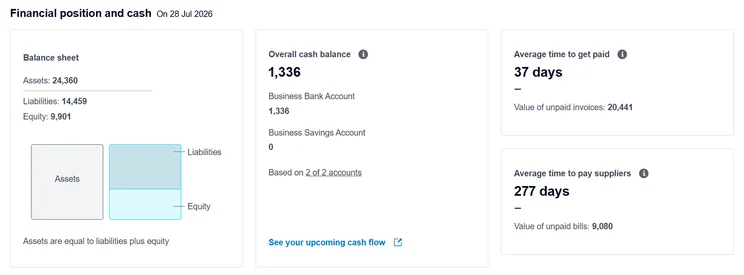
Debtor days is the average number of days it takes for your customers to pay their invoices after you sell to them. The lower the number, the faster your invoice payments arrive in your bank account.
Calculate the total number of unpaid invoices on your balance sheet at the end of a period (usually annually), divide that figure by your total credit sales over that time, and multiply by 365.
Note: If you find your debtor days are increasing, a bookkeeper can help you set up clearer payment terms and automated reminders in your accounting software to improve your cash flow and reduce chasing up late payers manually.
Which financial metrics help with Making Tax Digital (MTD) readiness?
With Making Tax Digital for Income Tax (MTDITSA) now mandatory for sole traders and landlords with qualifying income over £50,000 (and £30,000 from 6 April 2027), it’s crucial to have the right metrics ready so that you’re fully prepared for the next quarterly filing deadline.
By using cloud accounting software like Xero, both you and your accountant look at the same live dataset in real time. You handle the daily receipt logging and invoicing, while your accountant monitors your unreconciled transaction counts and reviews your estimated tax position before quarterly submission deadlines.
The key business financial metrics you should focus on to prepare for MTD are:
- Gross qualifying income: measures your total turnover before deducting any expenses. You should track this annually so you know your exact mandatory timeline.
- Unreconciled transaction count: the percentage (or volume) of bank transactions in your software that haven’t received a category or been backed by a receipt. Tracking this ensures you’re ready to file quarterly data to HMRC without any last-minute panic.
- Real-time estimated tax liability: an ongoing calculation of your upcoming income tax or VAT bill based on digital records entered to date. Tracking this monthly will help you set aside the exact financial reserve you need in real time.
- Debtor days and creditor days: how fast cash is entering (debtor days) and leaving (creditor days) your bank account. Keeping track of invoice settlement speeds ensures your MTD updates accurately reflect your cash position.
Whether you’re preparing for MTD for VAT or income tax (ITSA), digital accounting software can make tracking these metrics easier than manual spreadsheets. Tou can stay on top of VAT and MTD for Income Tax obligations with seamless submissions to HMRC from Xero (MTD for IT subject to registration and eligibility),
Conclusion
You don’t need a finance degree to run a healthy business, but understanding and tracking the right financial metrics is essential for its success.
From profitability measures like gross and net profit margin to cash flow and customer acquisition costs, these metrics give you the insights you need to make informed decisions, find any potential issues early, and plan confidently for future growth.
Using tools like Xero with a trusted accountant can help improve visibility over your numbers and provide expert guidance when making important decisions.
And with MTD in full swing, keeping accurate and up-to-date financial records is more important than ever. Accounting software like Xero can help you by automating accounting tasks and giving you real-time visibility into your financial health, helping you to stay compliant while making savvy financial decisions.
Yes. While software gathers and calculates the raw data, an accountant helps interpret what those numbers mean for your business strategy, ensures full compliance with HMRC, and helps you optimise tax planning.
No. Gross profit only considers revenue and COGS, and taxes like VAT are not a cost of producing or selling your products/services. If your business is VAT-registered, the VAT you collect on behalf of HMRC isn’t your revenue, and the VAT you pay on purchases isn’t usually treated as a business expense for profit calculations because it can often be reclaimed.
Small businesses without historical sales data can still come up with a realistic forecast by making informed assumptions about their market, pricing, and expected sales. Some common methods include forecasting how many products or services you expect to sell weekly or monthly (based on your capacity and expected customer demand), estimating demand through market research (industry reports, competitor pricing, local market size, etc.), building a sales pipeline (if you’re a service business, estimate how many enquiries you’ll receive, what percentage will become customers, and the average value of each sale), and creating multiple scenarios (prepare best-case, expected, and worse-case forecasts to understand how different sales outcomes would affect the business).
Ideally, both. Overall profitability tells you whether your business as a whole is making money, by product or service helps you identify which offerings generate the highest margins (and which may need repricing, cost reductions, or discontinuing), and by sales channel shows which channels (like your website, Amazon, Etsy, or a physical store) deliver the best return after accounting for costs like marketplace fees, advertising, shipping, and commissions. However, for very small businesses or startups, overall profitability is usually enough to begin with, as it’s simpler to calculate and monitor. However, as the business grows or sells multiple products through different channels, breaking down profitability gives you more actionable insight and can lead to better pricing, marketing, and investment decisions.
It depends on the specific metric, but most operational metrics – such as operating cash flow, gross profit margin and cash runway – should be reviewed monthly. Fast-growing startups, B2B businesses managing invoices, or retail brands may want to monitor cash flow and debtor days weekly or even daily to catch any cash as early as possible. Broader strategic metrics like Customer Lifetime Value (LTV) and break-even point are typically reviewed quarterly or whenever pricing and operational overheads change.
Startups.co.uk is reader-supported. If you make a purchase through the links on our site, we may earn a commission from the retailers of the products we have reviewed. This helps Startups.co.uk to provide free reviews for our readers. It has no additional cost to you, and never affects the editorial independence of our reviews.


